Dashboards
Traverse > Reports > Dashboards
Dashboards provide real-time, top-level views of all critical issues, services and infrastructure. Whereas service containers let you group tests and devices according to business-oriented views, the dashboards provide a more abstract way to organize information. For example, you might create a dashboard to monitor bandwidth across your entire network, or a dashboard that reports which devices are the top resource hogs.
To view the Dashboard
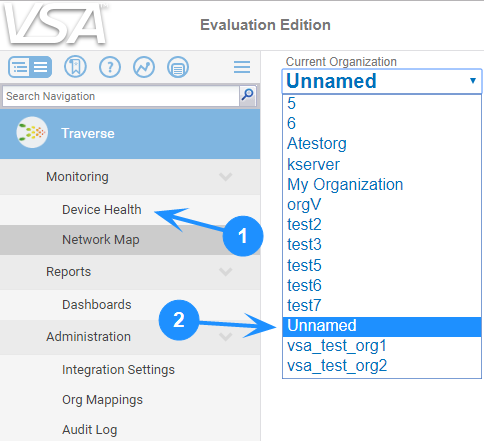
Click Reports > Dashboards and select an organization from the Current Organization drop-down list.
Managing Dashboards
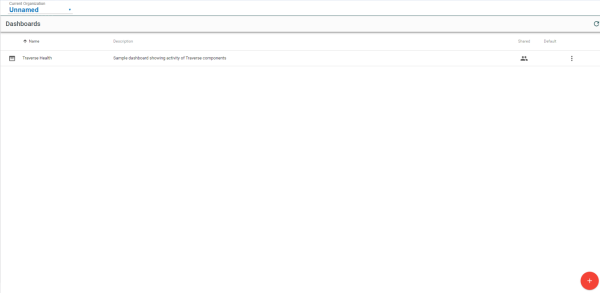
The Dashboards list shows any dashboards you have created, and the ones other have shared with you.
Creating a Dashboard
- Click the Create Dashboard
 icon.
icon. - In the Create Dashboard dialog, enter the following:
- Name - Enter a Dashboard name.
- Description - Enter a longer description.
- Visibility - Private or Public.
- Click Apply to create the dashboard.
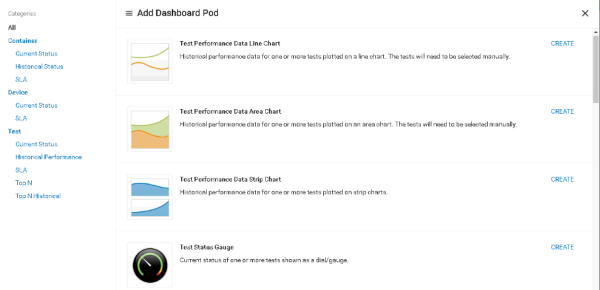
After the dashboard is created, you have to select pods with metrics you want to display.
- Select a pod category.
- Click the Create link for a pod template.
- Enter the Details for the pod instance you are creating. The set of fields can differ, as required by each pod template. Typical fields include:
- Name
- Type - Devices, Test, Containers
- Selection Method - Manual or Automatic. If Automatic you must provide a criterion for automatically selecting items.
- Limit / Count - Show items with either the greatest or least value.
- Refresh (min)
- Graph Period
- Maximum Value
- Sort Criteria
- Sort Direction
- Row Color
- Layout
- Scale
- Chart Layer Type
- Data Label
- Color
- Click Apply.
Each dashboard comprises one or more dashboard pods.
- You can drag and drop your dashboard components to arrange them in the dashboard.
- Click the maximize/minimize
 icons to resize a single pod.
Dashboard Row Options
Click a row's option  icon to select the following:
- Set as Default - Displays this dashboard by default.
- Details - Edits the dashboard's properties.
- Remove - Deletes the dashboard.


