Network Map
Traverse > Monitoring > Network Map
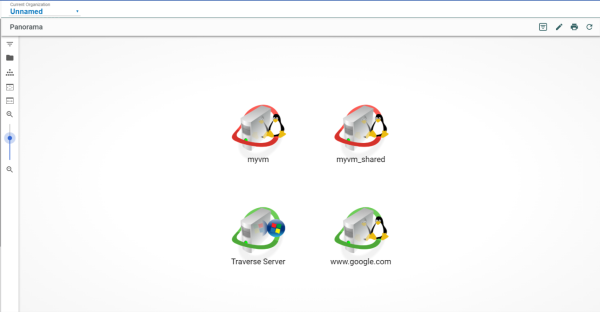
The Network Map displays a graphical representation of network topology and the devices in your network that are being monitored, including the status of the devices and the dependency relationships between them.
This view offers four different topology layouts, flexible display filters, pan and zoom functionality, the ability to configure and save custom views, and the ability to add or remove device dependencies. From this view you can drill down and work with the specific device and the tests provisioned on that device.
To view the Network Map
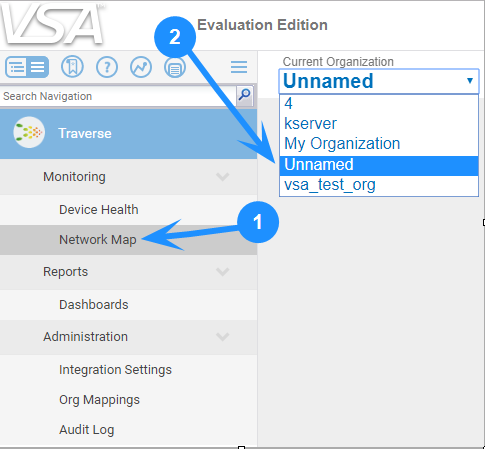
The Network Map displays the devices in the selected organization.
- Click Monitoring > Network Map and select an organization from the Current Organization drop-down list.
Device Information
Each device is represented by an icon that displays the name of the device. The color of the halo around the icon represents the status of the device.
|
Color |
Status |
|
Aqua |
Unconfigured |
|
Purple |
S |
|
Green |
OK |
|
Grey |
Transient or Unknown |
|
Light Blue |
Unreachable |
|
Yellow |
Warning |
|
Orange |
Critical |
|
Red |
Fail |
Working with dependencies
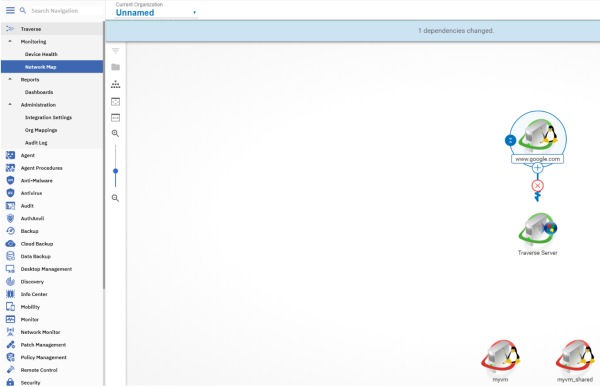
Dependencies are provided to suppress alerts in child devices when their parent device encounters an alert condition.
When one device depends on another, a line connects the parent and child devices in the Network map, with the corkscrew end of the line leading to the child.
Dependencies are created in two ways:
- When a discovery scan automatically detects a dependency between devices.
- Manually. You can create or edit device dependencies within Network Map.
To edit Device Dependencies
Click the  icon in Network Map to manually change dependencies in a topology.
- Add Dependencies - In edit mode, click and drag a new dependency link from the parent device to the child device.
- Edit Dependencies - Click the
 icon to save any changes.
 - Delete Dependencies - In edit mode, click the
 icon of a dependency link.
Once devices are linked by dependencies, you can expand or collapse a hierarchy by clicking the  or
or  icon next to a parent node.
Device Overview tab
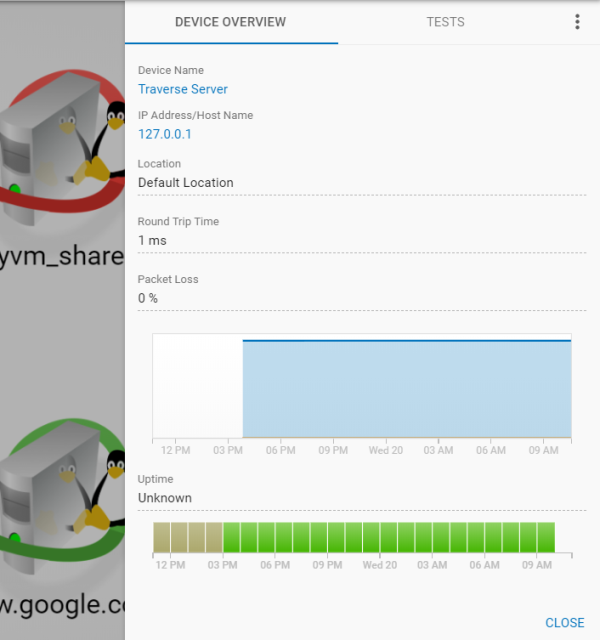
Click the name of a device to open the Device Overview for that device. Properties displayed include:
- Device Name
- IP Address/Host Name
- Device/OS Vendor (if available)
- Device/OS Model/Version (if available)
- Location
- In addition, selected metrics for that device
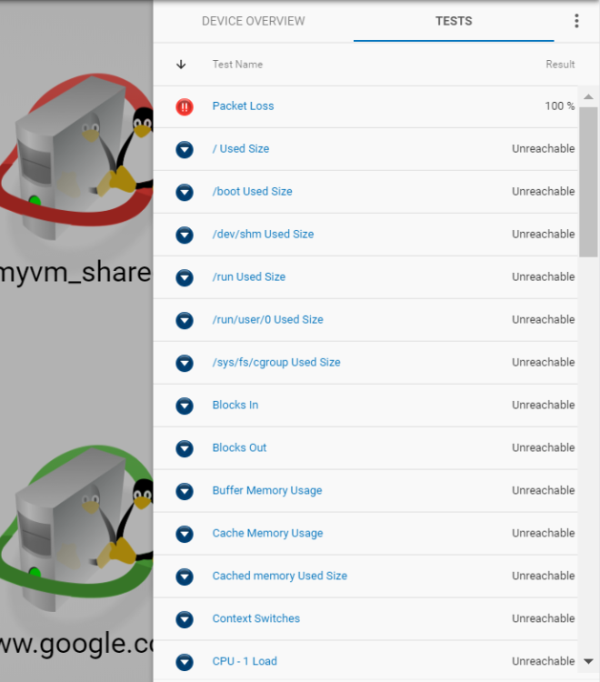
Tests tab
This tab lists the Tests provisioned for that device. Click any test to display the Chart View tab for that test on the Monitoring > Device Health page.
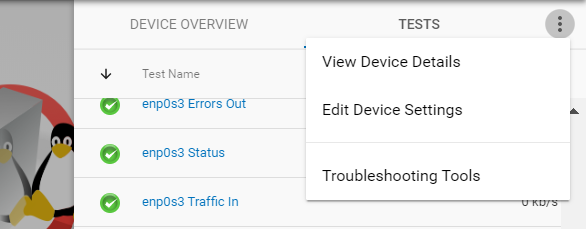
Device Context-Sensitive Options
When the Device Overview displays, you can click the options  icon to access context-sensitive options.
View Device Detail - Open Device Summary page.
Edit Device Settings - Redirect you to Traverse main page.
Troubleshooting Tools - Redirect you to Traverse main page.
Configuring Panorama Views
You can pan around the Network Map by clicking on the background and dragging it. Click  icon at the top of the page to print the currently displayed view.
Use the button bar on the left side of the Network Map to configure the view. The label for each button displays when you hover the mouse cursor over it.
-
 - Click the icon to filter items by one or more facets.
 -
 - Click the icon to filter items by a selected container.
 -
 - Switches the display of the icons between four available topology layouts:
-
 - Radial
 -
 - Hierarchy
 -
 - Grid
 -
 - Circular
-
-
 - Click the icon to display the entire image within the space available in your browser window.
 -
 - Click the icon to display the width of the entire image within the space available in your browser window. The image may still extend beyond the top and bottom of the available space.
 -
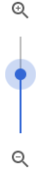 - Zoom In / Zoom Out / Slider Bar - These three controls enable you to resize the entire image to your specific preference. You can zoom in to 400% of the default size.
 -
 - Click the icon at the top right corner to save the topology, filter conditions and container choices you have made for a view.


