Toplist tab
NAVIGATION This tab displays with gateways, groups, and assets.
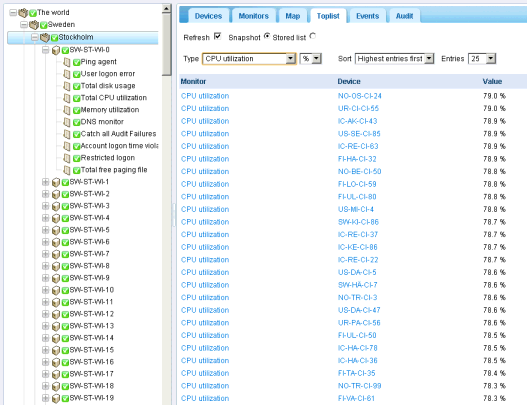
The Toplist tab displays the values returned by multiple assets for the same type of monitor. These values are continuously updated in real time. This enables you to compare the values and identify poor performing monitors. Because multiple assets are required for a toplist, only gateways and groups display a Toplist tab. Toplists can also be included in reports.
Actions
- Refresh - If checked, refreshes the page.
- Choose one of the following:
- Snapshot - A snapshot toplist displays the latest value for each monitor in the list.
- Stored list - Stored list toplists display the min,max and average of monitor values, for a selected daily, weekly and monthly time periods.
- Load - Displays only if Stored list is selected. Displays the selected toplist.
- Load for Compare - Compares two toplists.
- Select a first toplist and click Load.
- Select a second toplist of the same Type, then click Load to Compare.
The first toplist displays on the on left. The second toplist displays on the right. You can now see how the monitored properties for a particular monitor changed between the two toplists.
The following Sort options can only be used when comparing two toplists.
Top movers- Entries that have moved the most up or down.Top climbers- Entries that moved up the most.Top fallers- Entries that have moved down the most.
- Type - The toplist data type and unit of measure.
CPU utilizationDisk utilizationFree disk spaceBandwith utilizationPing roundtrip timePing packetlossFree memorySwap utilizationWebpage fetch time
- Data
Sampled min valueSampled max valuePeriod average
- Sort
Lowest entries firstHighest entries first
- Entries - Number of entries to display.
Table Columns
- Asset - The name of the asset. Click the name of the asset to jump to that node.
- Monitor - The name of the monitor. Click the name of the monitor to jump to that monitor.
- Value - The value returned by the latest test.


